
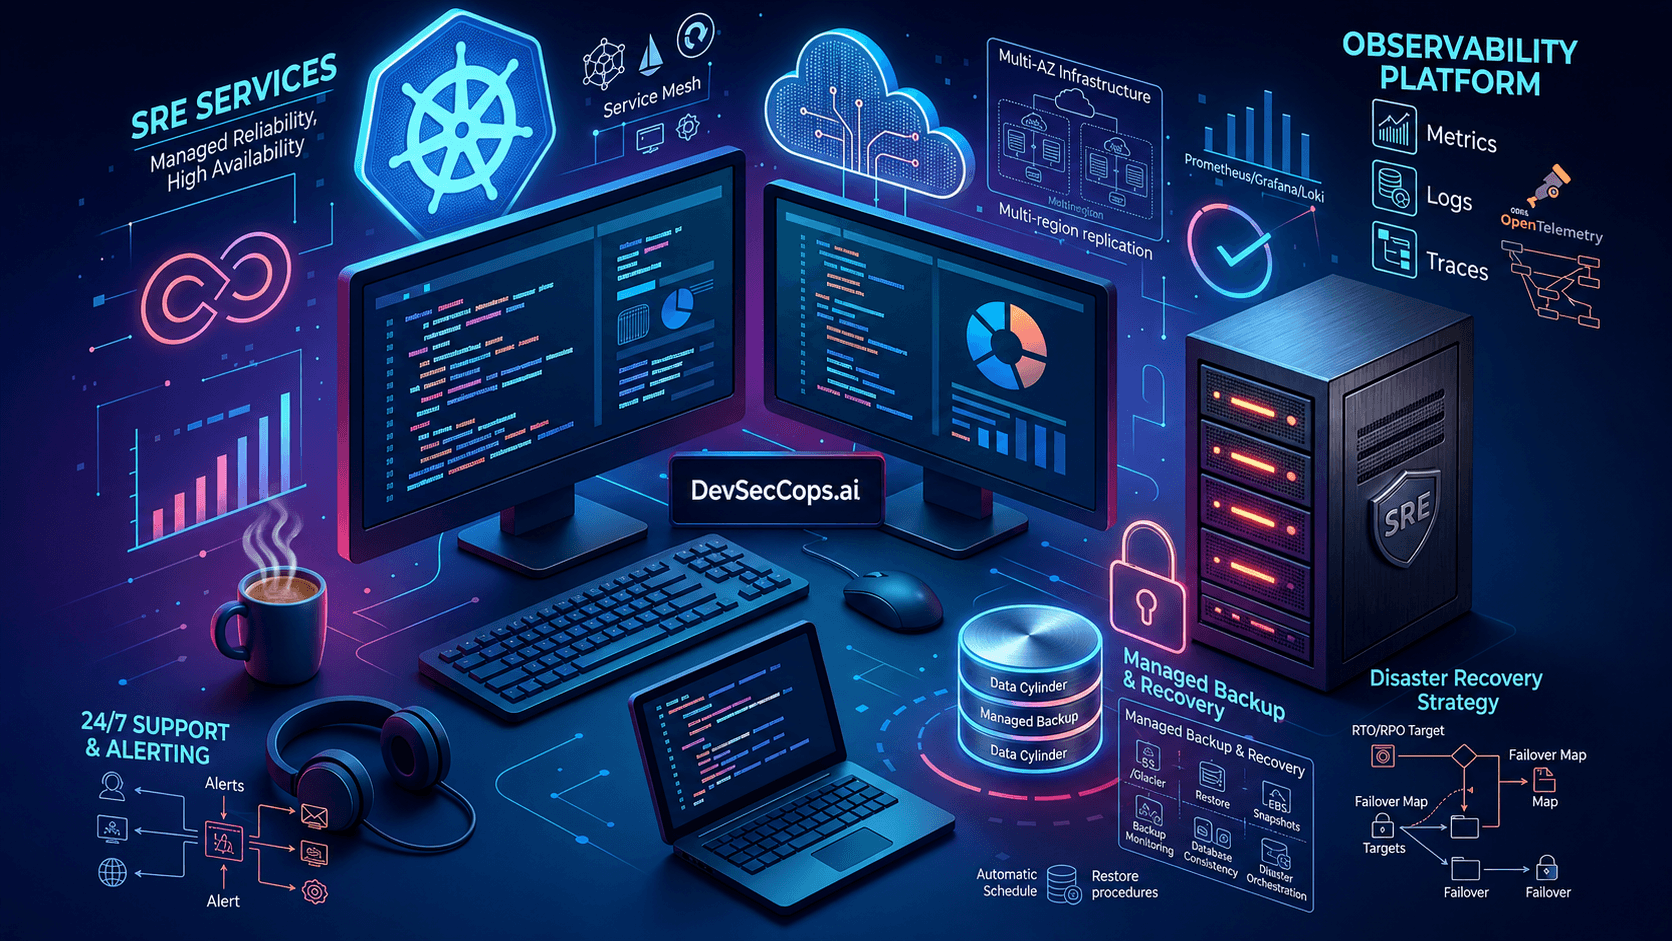
Build a More Reliable, Resilient & Always-On Technology Platform
DevSecCops provides managed SRE services that help businesses improve application reliability, reduce downtime, and operate critical infrastructure with confidence. From observability and proactive monitoring to automated incident response, disaster recovery, and high availability, we manage the reliability layer that keeps your business running.
Observability Services for
Reliable Cloud Operations
Gain clear, actionable visibility across your applications, infrastructure, and cloud environments. Our observability services bring metrics, logs, traces, and system signals together to help engineering teams detect issues earlier, understand their impact, and maintain reliable production environments.
Unified Observability
Bring application, infrastructure, Kubernetes, and cloud observability telemetry into one unified platform, giving your teams a complete view of system health and performance.
Outcome
One reliable source of operational visibility across your technology stack.
Application · Infrastructure · Kubernetes · Cloud — merged into one view
Proactive Reliability Monitoring
Move beyond reactive troubleshooting with continuous monitoring and intelligent signals that flag performance degradation, failures, and reliability risks before they become major incidents.
Anomaly flagged 12 minutes before customer impact
Outcome
Earlier detection and fewer unexpected production issues.
Application & Infrastructure Visibility
Monitor critical applications, services, infrastructure, and dependencies to understand how changes in one layer can impact the rest of your environment.
api-gateway → checkout-service · 42ms round-trip
Outcome
Faster root-cause analysis and better operational decision-making.
Observability Engineering
Our observability consulting services and observability implementation services design telemetry, dashboards, alerts, and workflows around your business-critical workloads — an enterprise observability solution built for you, not a generic template.
Deployed 3 minutes ago · notifies Slack & PagerDuty
Outcome
An observability foundation that scales with your applications and infrastructure.
Monitoring, Logging & Alerting for
Proactive Reliability
Stay ahead of incidents with continuous visibility and proactive response. Our managed monitoring services connect infrastructure, applications, logs, and alerts into a unified reliability workflow — helping your teams identify issues early and respond before they impact customers.
24/7 Infrastructure Monitoring
24/7 infrastructure monitoring services across servers, cloud infrastructure, Kubernetes clusters, databases, and critical services to catch performance degradation and failures.
128 servers monitored · avg CPU 42% · uptime 99.98%
Outcome
Greater infrastructure reliability with fewer unexpected disruptions.
OpenTelemetry Implementation for
Unified Telemetry
Standardize telemetry across your applications and infrastructure with OpenTelemetry. Our OpenTelemetry implementation services collect consistent metrics, logs, and traces across distributed environments, giving your teams the data they need to detect issues, troubleshoot faster, and improve reliability.
OpenTelemetry Implementation Services
Design and implement OpenTelemetry across applications, services, Kubernetes workloads, and cloud infrastructure to create a consistent telemetry layer.
Outcome
Standardized telemetry across your technology environment.
OpenTelemetry Integration
Connect your existing observability platforms, monitoring systems, and cloud environments without disrupting production workloads.
Outcome
Connect your existing tools and telemetry into a more unified observability architecture.
Distributed Tracing Implementation
Distributed tracing follows requests across microservices and dependencies, making it easier to identify latency, bottlenecks, and service failures.
Outcome
Faster root-cause analysis across complex distributed applications.
OpenTelemetry for Cloud & Kubernetes
Extend telemetry across Kubernetes, EKS, containers, and cloud-native workloads to provide consistent visibility as your infrastructure scales.
Outcome
Reliable observability across dynamic cloud-native environments.
Telemetry Optimization
Review and optimize existing telemetry pipelines to improve data quality, reduce costs, and ensure teams receive the signals that matter.
Outcome
More actionable observability with better control over telemetry volume and cost.
Prometheus, Grafana & Loki for
Actionable Observability
Turn operational data into clear, actionable insights. We implement and manage Prometheus, Grafana, and Loki to give engineering and operations teams real-time visibility into application performance, infrastructure health, Kubernetes workloads, and logs.
Prometheus Implementation & Monitoring
Prometheus Grafana implementation services for Kubernetes, EKS, infrastructure, and application workloads, with metrics tailored to your reliability requirements.
Outcome — Continuous visibility into system health, resource utilization, and application performance.
Grafana Dashboard Development
Grafana dashboard development services that bring critical infrastructure, application, Kubernetes, and business-relevant reliability metrics into a single operational view.
Outcome — Faster identification of issues and better data-driven operational decisions.
Loki Logging Implementation
Loki logging implementation for centralized, scalable log collection and analysis across Kubernetes and cloud-native workloads.
Outcome — Faster access to relevant logs without relying on fragmented logging systems.
Integrated Prometheus, Grafana & Loki Stack
Connect metrics, dashboards, and logs into a unified observability workflow, enabling teams to correlate system performance with application events and operational issues.
Outcome — Faster troubleshooting and stronger visibility across your production environment.
Managed Observability Stack
Managed Prometheus Grafana services provide ongoing management, optimization, and support for your stack as infrastructure and workloads evolve — available as standalone Prometheus Grafana consulting too.
Outcome — Reliable observability without adding another operational burden to your internal engineering team.
EFK Stack Implementation for
Centralized Logging
Centralize your application and infrastructure logs into a scalable, searchable, and operationally useful logging platform. Our EFK stack implementation services help organizations collect, process, analyze, and visualize logs across Kubernetes, cloud infrastructure, applications, and distributed environments.
EFK Stack Implementation
Design and implement Elasticsearch, Fluentd, and Kibana-based logging environments around your application and infrastructure requirements.
Elasticsearch → Fluentd → Kibana, wired end to end
A centralized logging platform that gives teams faster access to critical operational data.
Centralized Log Management
Centralized logging implementation services collect logs from applications, containers, Kubernetes clusters, infrastructure, and cloud services into one environment.
4 log sources · 1 centralized environment
Eliminate fragmented logging and simplify troubleshooting across complex environments.
Log Collection & Processing
Configure Fluentd-based log collection and processing pipelines to route, filter, enrich, and organize logs before they reach your analytics platform.
Raw entries filtered, enriched, and routed
Cleaner, more relevant log data with better operational usability.
Log Collection & Processing
Configure Fluentd-based log collection and processing pipelines to route, filter, enrich, and organize logs before they reach your analytics platform.
Raw entries filtered, enriched, and routed
Cleaner, more relevant log data with better operational usability.
Elasticsearch & Kibana Implementation
Configure Elasticsearch for scalable log storage and search, with Kibana dashboards and visualizations for operational analysis.
status:error · 214 matches across 3 services
Faster log investigation and improved visibility into application and infrastructure behavior.
Managed EFK Operations
ELK/EFK managed services covering performance, storage, log pipelines, dashboards, and operational health — also available as standalone EFK stack consulting.
Cluster green · storage 62% · no failed shards
Reliable centralized logging without adding ongoing platform management overhead to your internal team.
Managed Backup &
Recovery Services
Protect critical workloads and ensure your data is recoverable when it matters most. Our managed backup services help businesses establish automated, reliable, and monitored backup and recovery services across cloud infrastructure, databases, applications, and Kubernetes environments.
Automated Backup Implementation
Automated backup implementation for critical infrastructure, databases, applications, and cloud workloads, based on your recovery requirements.
Nightly snapshot · next run in 6h 20m
Outcome
Consistent backups without relying on manual processes.
Automated Backup Implementation
Automated backup implementation for critical infrastructure, databases, applications, and cloud workloads, based on your recovery requirements.
Nightly snapshot · next run in 6h 20m
Consistent backups without relying on manual processes.
Cloud & Infrastructure Backup
AWS backup solutions and broader cloud backup services for enterprises, covering business-critical workloads across AWS environments and Kubernetes-based platforms.
3 regions · 42 volumes · replicated hourly
Greater protection against infrastructure failures, accidental deletion, and operational incidents.
Database Backup Services
Database backup services with automated schedules, retention policies, monitoring, and recovery procedures aligned with your operational requirements.
Daily · weekly · monthly · yearly retention chain
Improved data protection and greater confidence in database recovery.
Backup Monitoring & Validation
Monitor backup jobs and regularly validate backup integrity to identify failed or incomplete backups before they become a recovery problem.
1 job flagged · integrity check running now
Backups you can rely on when production recovery is required.
Backup & Recovery Strategy
Design backup policies around workload criticality, retention requirements, recovery objectives, and disaster recovery plans.
Critical workloads · RPO 15m · RTO 1h
A structured data protection strategy aligned with your business continuity requirements.
Disaster Recovery Services for
Business Continuity
Keep critical business operations running when infrastructure failures, outages, or major incidents occur. Our disaster recovery services help organizations design, implement, and continuously improve recovery environments that minimize downtime and protect critical applications and data.
Disaster Recovery Implementation
Recovery capability built around business-critical apps, infrastructure, databases, and cloud workloads.
Regional outage detected · 03:14 UTC
Outcome
A structured recovery capability designed to restore critical services when failures occur.
AWS Disaster Recovery
Resilient AWS recovery architectures using the right redundancy, backup, replication, and failover strategy.
us-east-1 → us-west-2 · failover in 42s
Outcome
Greater resilience against infrastructure failures and regional disruptions.
Disaster Recovery Strategy
Recovery priorities, dependencies, and procedures defined around your business-critical workloads.
Tier 1 workloads restored within 1h RTO
Outcome
A clear and actionable recovery strategy instead of relying on ad-hoc recovery processes.
Recovery Testing & Validation
Recovery procedures tested regularly to validate critical apps and data restore within RTO.
Quarterly DR test · 5/5 checks passed
Outcome
Greater confidence that your DR environment will work when you actually need it.
Business Continuity & Disaster Recovery
Technical DR aligned with business priorities to minimize disruption during major incidents — a full solution, not a checkbox.
Operations resumed · availability back to 99.99%
Outcome
Reduced business impact and faster recovery from serious technology disruptions.
Trusted by forward-thinking teams





Frequently Asked Questions
Everything you need to know about SRE and reliability engineering with DevSecCops.ai — and if it's not here, our team is one message away.
Q01What's the difference between managed SRE services and an outsourced SRE team?
Managed SRE services typically extend your existing engineering team with specific reliability functions such as monitoring, observability, backup, incident management, and reliability optimization. An outsourced SRE team can take broader responsibility for ongoing reliability and operations. The right model depends on your team's capabilities, workload criticality, and level of operational ownership required.
Q02What does SRE consulting include, and how is it different from SRE implementation?
SRE consulting focuses on designing the reliability strategy, architecture, tooling, monitoring approach, and reliability objectives. SRE implementation turns that strategy into a working environment by implementing observability, monitoring, alerting, automation, backup, recovery, and other reliability capabilities. We can provide either as standalone engagements or as part of ongoing managed SRE services.
Q03Do you offer 24/7 SRE support and monitoring?
Yes. We provide 24/7 SRE support services for production-critical environments, including infrastructure and application monitoring, proactive alerting, incident support, and reliability management. Coverage can also be scoped around the specific uptime and operational requirements of lower-criticality workloads.
Q04What's the difference between observability and traditional monitoring?
Traditional monitoring primarily tells you that something is wrong. Observability provides deeper context into why it is happening by correlating metrics, logs, traces, and other telemetry signals. Our observability services help engineering teams identify root causes faster and understand the relationships between applications, infrastructure, Kubernetes workloads, and dependencies.
Q05Do you provide OpenTelemetry consulting and implementation services?
Yes. Our OpenTelemetry consulting and implementation services help organizations establish a standardized telemetry layer across applications, microservices, Kubernetes, and cloud infrastructure. We can support OpenTelemetry adoption, integration with existing observability platforms, distributed tracing, telemetry pipelines, and migration from legacy or vendor-specific monitoring approaches.
Q06Can you implement and manage Prometheus, Grafana, and Loki?
Yes. We provide Prometheus, Grafana, and Loki implementation and managed services for infrastructure, applications, Kubernetes, and cloud-native environments. Services can include Prometheus monitoring, Grafana dashboard development, Loki logging implementation, metrics and log correlation, alerting, and ongoing optimization of the observability stack.
Q07Do you provide EFK and centralized logging implementation?
Yes. We provide EFK stack implementation, centralized logging implementation, and managed EFK services for cloud and Kubernetes environments. We can centralize application, container, infrastructure, and Kubernetes logs to provide consistent log collection, processing, search, visualization, and troubleshooting capabilities.
Q08What's the difference between backup and Disaster Recovery as a Service (DRaaS)?
Backup protects copies of your data so they can be restored when needed. Disaster Recovery as a Service focuses on restoring critical applications and infrastructure after a major disruption, including recovery architecture, failover procedures, recovery objectives, and testing. A resilient environment typically needs both reliable backups and a tested disaster recovery strategy.
Q09Do you provide AWS-specific backup and disaster recovery solutions?
Yes. We provide AWS backup solutions and AWS disaster recovery services designed around the architecture, workload requirements, and recovery objectives of AWS environments. Services can include automated backups, replication, recovery architecture, failover planning, and recovery testing for critical workloads.
Q10What's the difference between High Availability and Disaster Recovery?
High availability is designed to keep applications and infrastructure running through expected failures such as instance, server, or availability-zone failures. Disaster recovery focuses on recovering critical workloads after larger-scale disruptions. High availability reduces interruption during failures, while disaster recovery provides a recovery strategy when normal redundancy is insufficient.
Q11How can SRE services reduce downtime and production incidents?
SRE combines proactive monitoring, observability, alerting, incident response, reliability engineering, and continuous improvement to identify and address reliability risks before they significantly affect users. By correlating metrics, logs, traces, infrastructure health, and application behavior, SRE teams can detect issues earlier, accelerate root-cause analysis, and improve recovery processes.
Q12How do you measure and improve the reliability of our production environment?
We assess reliability across observability, monitoring, alerting, application and infrastructure performance, incident response, backup and recovery, disaster recovery, and high availability. Based on the assessment, we prioritize reliability improvements according to business impact, operational risk, and implementation effort, creating a practical path toward more resilient production systems.
Running your platform out of India? See our SRE services in India — 24/7 on-call, peak-season readiness, and CERT-In / DPDP evidence.
Ready to Build a More
Reliable Engineering Platform?
Talk to our SRE team about Site Reliability Engineering, SRE Automation, Observability, Kubernetes Reliability, Incident Management, or Platform Performance. Get a clear view of your current reliability posture, operational bottlenecks, and highest-priority improvements before they impact production — with no commitment.