
Linux /proc Directory Explained: Accessing Process and System Information for DevOps and MLOps
Linux /proc directory explained, access process and system information for DevOps and MLOps
The /proc directory in Linux known as the proc file system or procfs, is a virtual file system. The /proc file system is used in real-time process and system information monitoring. The /proc file system is foundational system monitoring and automation in DevOps use cases.
Modern infrastructure teams integrate with DevOps technologies, AI DevOps platforms, MLOps pipelines, log monitoring systems, and security monitoring systems to provide automation of operations.
This article explores the structure of the proc file system in Linux, its key use cases, and how DevOps and MLOps professionals can harness it for performance, observability, and security.

What Is the /proc Directory in Linux?
The /proc directory is a pseudo-file system that resides in memory, not on disk. It dynamically presents runtime system data such as CPU details, memory usage, and per-process information. For example:
- /proc/cpuinfo: CPU architecture and core details
- /proc/meminfo: Memory usage statistics
- /proc/[pid]: Process-specific information
- /proc/stat: System-wide statistics
Since /proc is a virtual interface, its contents reflect the current state of the system in real time. This makes it ideal for monitoring, diagnostics, and automation.
Why /proc Matters for DevOps
DevOps tools frequently query data from /proc to monitor performance, trigger alerts, and optimize CI/CD pipelines. For instance:
- Tools for monitoring like Amazon CloudWatch are capable of collecting metrics from /proc/stat or /proc/meminfo to measure CPU and memory usage.
- Automation tools like Jenkins or ArgoCD can execute scripts that read the values in /proc and respond asynchronously to changes in the system.
- AI DevOps platforms can analyze historical /proc data trends to detect bottlenecks, improving system stability and deployment reliability.
According to internal case studies, DevOps teams that incorporated /proc data into their pipelines saw up to 40% faster incident response times and improved pipeline efficiency.
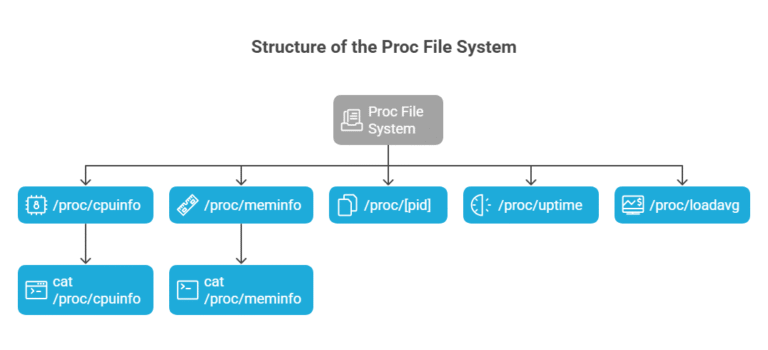
Structure of the Proc File System
The proc file system organizes runtime information into files and subdirectories. Some commonly used files include:
- /proc/cpuinfo: Reports CPU architecture, model, and cores
- /proc/meminfo: Displays memory usage and availability
- /proc/[pid]: Contains process-specific info like memory maps (/proc/[pid]/maps)
- /proc/uptime: Shows how long the system has been running
- /proc/loadavg: Displays system load averages
Accessing these files is as simple as running commands like:
Bash
cat /proc/cpuinfo
cat /proc/meminfo
Automating Monitoring with /proc Data
Automation allows DevOps engineers to write scripts to extract information from /proc, add to a Git repo, and automatically deployed using Jenkins or ArgoCD.
As an example, the event could be a script that checks /proc/meminfo, which triggers alerts for memory usage when a certain point is passed. Additionally, this reduces human oversight and builds event-driven CI/CD in practice.
Enhancing Observability with AI DevOps Platforms
Modern DevOps platforms with AI capabilities can process /proc data to detect anomalies and predict failures. For example:
- AWS CloudWatch Insights can use /proc/stat data to forecast CPU saturation.
- AI platforms can generate recommended scripts to query and monitor key system files.
Teams using AI-enhanced DevOps tools reported improved system uptime and more reliable deployment pipelines, especially in hybrid cloud environments.
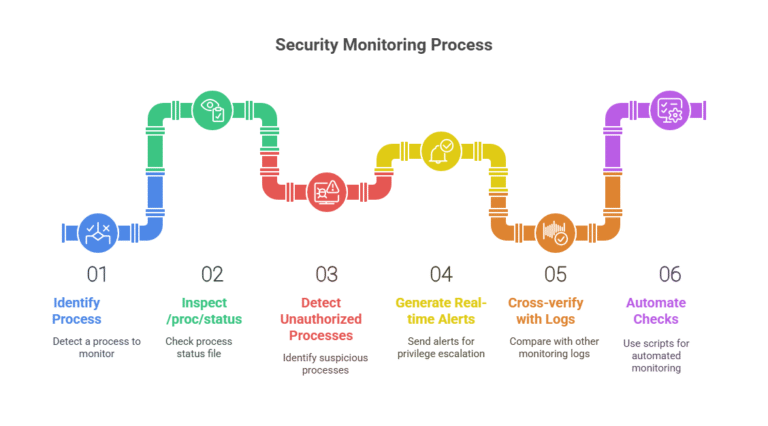
Security Monitoring with /proc
Security tools like Sysdig and Falco inspect /proc/[pid]/status and other files to monitor process behavior. This enables:
- Detection of unauthorized or suspicious processes
- Real-time alerts for privilege escalation
- Cross-verification with logs from other monitoring tools
Security scripts stored in Git repositories can automate these checks, reinforcing secure DevOps practices aligned with DevSecOps methodologies.
Using /proc in MLOps Pipelines
MLOps platforms like Amazon SageMaker benefit from /proc data to allocate compute resources intelligently. Examples include:
- Using /proc/cpuinfo to match models with optimal hardware
- Scaling training jobs dynamically based on /proc/loadavg
Scripts automating these checks can be stored in Git repositories and executed during model training jobs, enhancing performance and cost-efficiency.pi
Managing Git Repositories for Monitoring Scripts
To enable automated deployments of monitoring scripts:
Initialize a bare Git repository:
bash
git init –bare monitoring-scripts.git
Push scripts from a working repo:
bash
git remote add origin /path/to/monitoring-scripts.git
git push origin main
- Integrate with ArgoCD or Jenkins to deploy the scripts on monitoring or production clusters.
This ensures version control, traceability, and consistency in your DevOps workflows.
/proc in Hybrid Cloud and AWS
In hybrid environments, /proc helps ensure compatibility between on-premises systems and AWS instances. During cloud migration:
- Data from /proc/meminfo or /proc/cpuinfo helps benchmark resource requirements.
- Monitoring scripts using /proc ensure consistency between environments.
- Tools like CloudWatch and Security Hub can ingest and visualize this data.
Firms leveraging this method during cloud migration have reported smoother transitions and improved post-migration observability.
Getting Started: DevOps for Beginners
If you’re new to DevOps, start with basic /proc commands:
Bash
cat /proc/cpuinfo # View CPU details
cat /proc/meminfo # Check memory usage
cat /proc/uptime # See system uptime
You can automate these into shell scripts and manage them with Git. Use beginner-friendly platforms to schedule and monitor these scripts for hands-on learning.
Best Practices for Using /proc in DevOps
- Automate: Use AI platforms and CI/CD tools to automate /proc data collection and response.
- Secure: Monitor /proc for unusual process behavior to detect threats.
- Optimize: Feed /proc data into observability and MLOps platforms for better performance.
- Version Control: Store all scripts in Git for traceability.
- Integrate: Use tools like Jenkins and ArgoCD to deploy and manage /proc-based monitoring.

Conclusion
The Linux /proc directory is a powerful virtual file system that underpins observability, automation, and security in DevOps and MLOps workflows. By combining /proc data with modern tools like AI DevOps platforms, log monitoring systems, and CI/CD automation, teams can achieve scalable, efficient, and secure operations.
Whether you’re a beginner or a seasoned engineer, mastering /proc can greatly enhance your infrastructure insight and control.
Learn more at DevSecCops.ai—your partner in automated, AI-driven DevOps and platform engineering.