Building a Log Monitoring System: Tools, Techniques, and How It Differs from Log Analysis

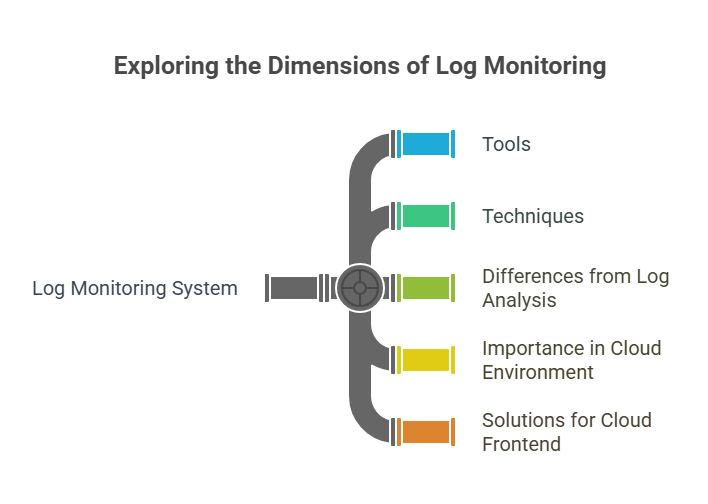
In the era of cloud computing and rapid software deployment, a log monitoring system is indispensable for maintaining system reliability, security, and performance. But what is log monitoring? It’s the real-time tracking of log data—event records from systems, applications, or networks—to detect issues, anomalies, or security threats instantly. This blog explores how to build an effective log monitoring system, highlights top log management tools and log monitoring tools (including open-source options), and explains how it differs from log analysis. We’ll also cover why logging and monitoring are important in a cloud environment, especially for frontend teams, and evaluate the best logging solutions for cloud frontend and cloud logging platforms.

What is a Log Monitoring System?

Monitoring systems typically monitor system log files and other logging data for issues and incidents (performance, error, and security) via real-time detection. Such systems do not perform log analysis to gain insights from historical data; they detect and alert on the immediate, the now. An example of monitoring is during application log monitoring (see CI and CD below) spike in API errors, or during security logging and monitoring an alert could indicate unauthorized access attempts by an external party, so that you could respond right away.

What are system log files? These are event records generated by operating systems, applications, or devices, including information such as timestamps, error codes, or actions performed by users. Log monitoring systems utilize device log analyzers to flatten the logs into a single view of system health.

Why are Logging and Monitoring Important in a Cloud Environment?

Logging and monitoring are critical in cloud environments due to their distributed and dynamic nature. Cloud systems generate massive amounts of log data across services, making a robust log monitoring system essential for tracking issues. Logs from user-facing applications (e.g., web servers or APIs) are essential for frontend teams to detect latency or UI errors. Why is logging and monitoring important in a cloud environment? By logging and monitoring, you maintain maximum uptime for your applications, enhance user experience, and enhance security through real-time detection of threats (i.e. DDoS, breaches). A well-designed log monitoring system can help as it relates to regulatory obligations such as GDPR or HIPAA through audit trails.

Key Components of a Log Monitoring System

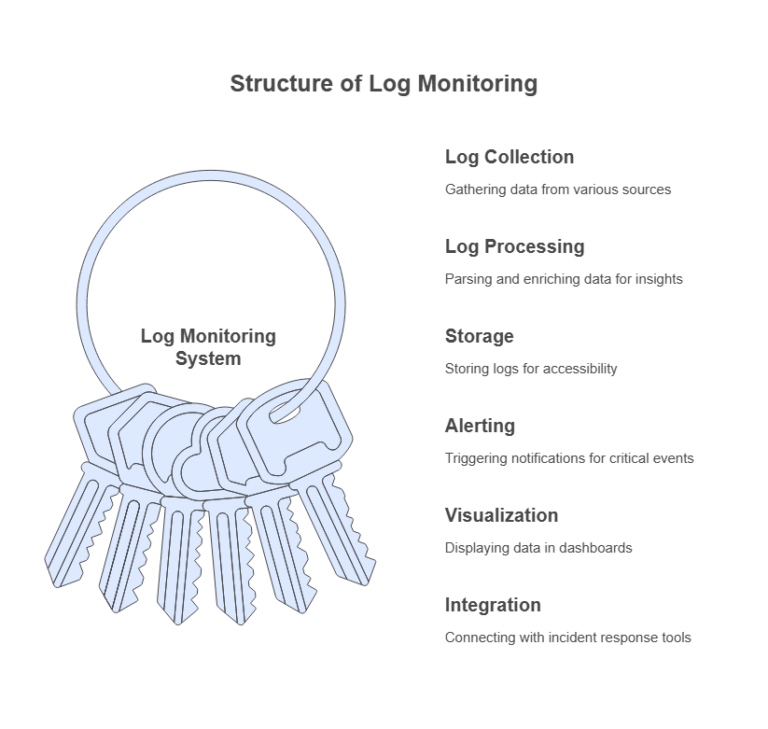
A log monitoring system comprises several components:

  1. Log Collection: Aggregating log data from servers, applications, or cloud services.
  2. Log Processing: Parsing and enriching logs for actionable insights.
  3. Storage: Storing logs for real-time access and querying.
  4. Alerting: Triggering notifications for critical events.
  5. Visualization: Displaying data in dashboards for quick insights.
  6. Integration: Connecting with incident response tools.

Top Log Management Tools and Log Monitoring Tools

Several log monitoring tools and top log management tools enable a scalable log monitoring system. Here are some of the best, including open-source log monitoring tools option:

1. Log Collection and Aggregation

  • Fluentd: An open-source log monitoring tool that collects logs from sources like Kubernetes, AWS, or databases, with extensive plugin support.
  • Logstash: Part of the Elastic Stack, Logstash is ideal for collecting and processing logs in a log monitoring system.
  • Filebeat: A lightweight log monitoring tool for shipping server logs to centralized device log analyzers like Elasticsearch.

2. Log Storage and Indexing

  • Elasticsearch: A robust engine for storing and indexing log data, widely used in centralized device log analyzers.
  • Loki: An open-source log monitoring tool by Grafana Labs, optimized for cost-effective log storage.
  • OpenSearch: A community-driven alternative to Elasticsearch, suitable for scalable log monitoring systems.

3. Visualization and Dashboards

  • Kibana: Paired with Elasticsearch, Kibana offers dashboards for application log monitoring and real-time insights.
  • Grafana: Integrates with Loki to provide customizable dashboards, ideal for frontend teams monitoring log data.
  • Graylog: An open-source log monitoring tool combining log management, visualization, and alerting.

4. Alerting and Notification

  • Prometheus with Alertmanager: Integrates with log monitoring systems to trigger alerts based on log-derived metrics.
  • PagerDuty: Routes alerts from log monitoring tools to the appropriate team members.
  • Slack/Email: Many log monitoring systems support notifications via Slack or email.

5. Security and Compliance

  • Wazuh: An open-source log monitoring tool for security logging and monitoring, offering intrusion detection and compliance features.
  • Splunk: A commercial platform excelling in security logging and monitoring and compliance reporting.

Is It the Best Cloud Logging Platform for Frontend Teams?

Front end teams want a cloud logging platform that is easy to use, provides real-time insight, and has cloud native support. Grafana Loki and Kibana are among the best logging solutions for cloud frontend because of their lightweight architecture and good visualization. For instance, Grafana works with AWS or Azure giving front-end teams the means of tracking API response time or client side errors. Elasticsearch with Kibana is also one of the top contenders, particularly good querying and dashboards. It’s great for application logging in cloud environments.

Techniques for Building a Log Monitoring System

Key techniques for an effective log monitoring system include:

  1. Centralized Log Aggregation: Implement centralized device log analyzers (e.g., Fluentd, Logstash) to aggregate log data.
  2. Real-Time Parsing: Use both ingestion and advertisement of fields (such as timestamp or error code) in parsing the system log files (e.g., monitoring application logs).
  3. Anomaly Detection: Identify anomalistic behavior (e.g., traffic spike, repeated error log) via machine learning systems or by rule-based systems.
  4. Alerting Rules: Define alerts, e.g., if the 5xx error exceeds 10 alarms in 5 minutes, notify me.
  5. Scalable Storage: If you need cost-effective storage, then use Loki, or use Elasticsearch for faster indexing and searching at higher cost.
  6. Visualization: Create dashboards with log monitoring tools (e.g., Kibana/Grafana) to use on collating key metrics together.
  7. Integration: Integrate with your incident response application (e.g., PagerDuty, etc.) to allow material for seamless incident response workflows.

How Log Monitoring Differs from Log Analysis

A log monitoring system and log analysis both handle log data but serve different purposes:

  • Purpose: A log monitoring system focuses on real-time issue detection, such as outages or security threats, while log analysis extracts insights from historical data for trends or root causes.
  • Timeframe: Log monitoring tools operate in real time, whereas log analysis examines data over longer periods.
  • Tools: Log monitoring tools like Fluentd or Grafana prioritize alerting, while log analysis tools like Splunk are strong in querying and reporting and also support monitoring use cases.


  • Output: A log monitoring system generates alerts or dashboards, while log analysis produces reports or recommendations.

For example, a log monitoring system might alert frontend teams to a spike in 500 errors, enabling quick action. Later, log analysis could reveal a database bottleneck causing those errors, suggesting infrastructure improvements.

Steps to Build a Log Monitoring System

  1. Define Requirements: Identify sources (e.g., cloud services, applications) and log types for application log monitoring or security logging and monitoring.
  2. Select Tools: Choose log monitoring tools like Fluentd, Elasticsearch, or Grafana based on needs and budget.
  3. Configure Collection: Set up centralized device log analyzers to normalize log data.
  4. Set Alerts: Define rules for critical events, integrating with notification systems.
  5. Build Dashboards: Use log monitoring tools to create visualizations for key metrics.
  6. Test and Refine: Simulate issues to ensure alerting accuracy.
  7. Scale: Optimize storage and processing as log data volume grows.

Conclusion

Log monitoring systems are an essential component of cloud contract initiatives to help maintain reliable, secure, and performant systems. By using the best log management tools and processors like Fluentd, Elasticsearch, and Grafana and methods like real-time parsing, and anomaly detection on the logs, we can build powerful systems. Why are logging and monitoring so important to cloud environments? Logging provides system uptime, security enhancement, and compliance.

For front-end teams, the leading cloud logging platforms, such as Grafana Loki or Kibana, focus on application log monitoring. Solutions like DevSecCops.ai, which is an AI DevOps platform, further add value to a log monitoring system by leveraging security scanning solutions integrated with DevOps capabilities. This integration automates threat detection and compliance checks so that the front-end team can take quicker action and have a clearer operational workflow. Log monitoring systems allow teams to take action in real-time but are intended for log monitoring even more in the long run, ensuring operational efficiency and longer-term growth.