In today's fast-paced digital landscape, ensuring the health and security of applications and infrastructure is critical for businesses. A log monitoring system provides real-time visibility into system performance, security events, and operational issues, enabling teams to proactively address problems. By leveraging DevOps AI tools and modern DevOps technologies, organizations can build robust log monitoring solutions that integrate seamlessly and enhance operational efficiency.
This blog will guide you through creating a log monitoring system, exploring its components, tools, and best practices, while incorporating central log management and security logging and monitoring for a comprehensive solution. You will also find logging and monitoring basics, log monitoring tools, application log monitoring, and cloud and multicloud logging covered along the way.
What Are Logs?
Logs are timestamped records of events produced by software, infrastructure and networks. Each entry says what happened, when, where, and ideally in what context. They are the raw material for both troubleshooting and security investigation.
A well-formed entry carries enough context to act on without opening a second tool: 2026-03-02T09:14:07Z WARN [orders-api] order_id=88231 upstream=inventory status=503 retries=3 trace_id=7f3a9c — in one line you can see the service, the failing dependency, the severity, and a trace ID to follow the same request through other services.
Application Logs
Written by your own code: handled and unhandled exceptions, request outcomes, and business events such as a failed payment. Application log monitoring starts here because most debugging does.
System Logs
Generated by the operating system: service starts and stops, kernel messages, disk errors and authentication events (for example /var/log/auth.log on Linux or the Windows Event Log).
Infrastructure Logs
Records from the platform your code runs on: load balancers, databases, API gateways, DNS, firewalls and network flow logs. They often explain problems that never show up in application logs, such as connection resets or a saturated disk.
Security Logs
Authentication attempts, permission changes, access to sensitive data and cloud audit trails. They answer the questions auditors and incident responders ask first: who did what, from where, and when?
Cloud and Kubernetes Logs
Cloud audit and service logs (AWS CloudTrail, Azure Activity Log, Google Cloud Audit Logs), plus container output, Kubernetes events and control-plane logs. Containers are ephemeral, so these logs must be shipped off the node before the container disappears.
What Is Log Monitoring?
Log monitoring refers to the process of collecting, analyzing, and visualizing log data generated by applications, servers, and infrastructure components. Logs are records of events, errors, or activities within a system, often stored in log files. What is system logging? It's the mechanism by which systems generate these records, which can include basic error logs, transaction details, or security log management data. A log monitoring system ensures that these logs are continuously tracked, providing insights into system health, performance bottlenecks, and potential security threats.
In short: log monitoring is the continuous, real-time collection, analysis and alerting on log data so teams can detect problems, investigate incidents and keep systems and applications healthy. A log monitor keeps watching as events arrive, so a failure at 2 AM reaches the on-call engineer at 2:01 AM instead of surfacing at the next stand-up.
Logging vs Monitoring: What Is the Difference?
People often use logging and monitoring interchangeably, but they do different jobs.
| Logging | Monitoring | |
|---|---|---|
| What it does | Records events as they happen | Watches data continuously and reacts |
| Output | Log files and streams | Dashboards, alerts, reports |
| Question it answers | What happened? | Is something wrong right now? |
| Works without the other? | Yes, but nobody may read it | Not for log-based signals |
Logging is the record; monitoring is the attention. Monitoring and logging together turn raw events into early warnings. If you only log, you find problems after customers do.
Why Are Logs Important?
Logs are the backbone of observability in IT systems. They serve multiple purposes.
- Troubleshooting: Basic error logs help identify the root cause of application failures or performance issues.
- Security: Security logging and monitoring track suspicious activities, such as unauthorized access attempts or anomalies, ensuring security log management.
- Performance Optimization: Application log analysis reveals bottlenecks, slow queries, or resource-intensive processes.
- Compliance: Logs provide an audit trail for regulatory requirements, especially in industries like finance and healthcare.
- Operational Insights: Event logging software helps teams understand system behavior and user interactions.
- Faster Incident Detection: Real-time alerts shorten the time between a failure and your team knowing about it.
- Application Visibility: Logs show what individual services are actually doing, not what you assume they do.
- Infrastructure Visibility: Hosts, networks and cloud services stop being black boxes.
- Root-Cause Investigation: One query can reconstruct the sequence of events behind an outage.
Without a robust log monitoring system, organizations risk delayed issue detection, prolonged downtimes, and security vulnerabilities.
Key Components of a Log Monitoring System
Building a log monitoring system requires integrating several components to ensure scalability, reliability, and real-time visibility. Here's a breakdown of the essential elements.
Log Collection
Log collection involves gathering log files from various sources, such as servers, applications, databases, and cloud services. Tools like Fluentd, Logstash, or Filebeat can aggregate logs from distributed systems, ensuring central log management. For cloud-based environments, cloud log management solutions like AWS CloudWatch or Google Cloud Logging are popular choices.
Log Storage
Once collected, logs need to be stored efficiently for analysis. Central log management systems like Elasticsearch or Loki provide scalable storage solutions. These platforms allow you to index logs for quick retrieval and support application log analysis through advanced querying capabilities.
Log Analysis and Processing
Log file monitoring involves parsing and analyzing logs to extract meaningful insights. Tools like the ELK Stack (Elasticsearch, Logstash, Kibana) or Grafana Loki enable teams to filter, search, and visualize log data. DevOps AI tools can enhance this process by using machine learning to detect anomalies or predict issues based on historical log patterns.
Visualization and Alerting
Real-time visibility requires intuitive dashboards and alerting mechanisms. Logging monitoring tools like Kibana, Grafana, or Splunk provide customizable dashboards to visualize log data. Alerts can be configured to notify teams via email, Slack, or PagerDuty when specific thresholds are breached, such as a spike in basic error logs.
Security and Compliance
For security log management, logs must be analyzed for potential threats, such as repeated failed login attempts or unusual API calls. Server log monitoring software like Splunk or Sumo Logic can integrate with SIEM (Security Information and Event Management) systems to enhance security logging and monitoring.
Log Enrichment and Metadata
Enrichment adds context to every record: environment, region, service name, version, pod or host, and request or trace ID. This is what lets you filter precisely and correlate events across services. Adding it at collection time is far cheaper than trying to reconstruct it during an incident.
How Does Log Monitoring Work?
Every log entry follows the same journey from creation to action.
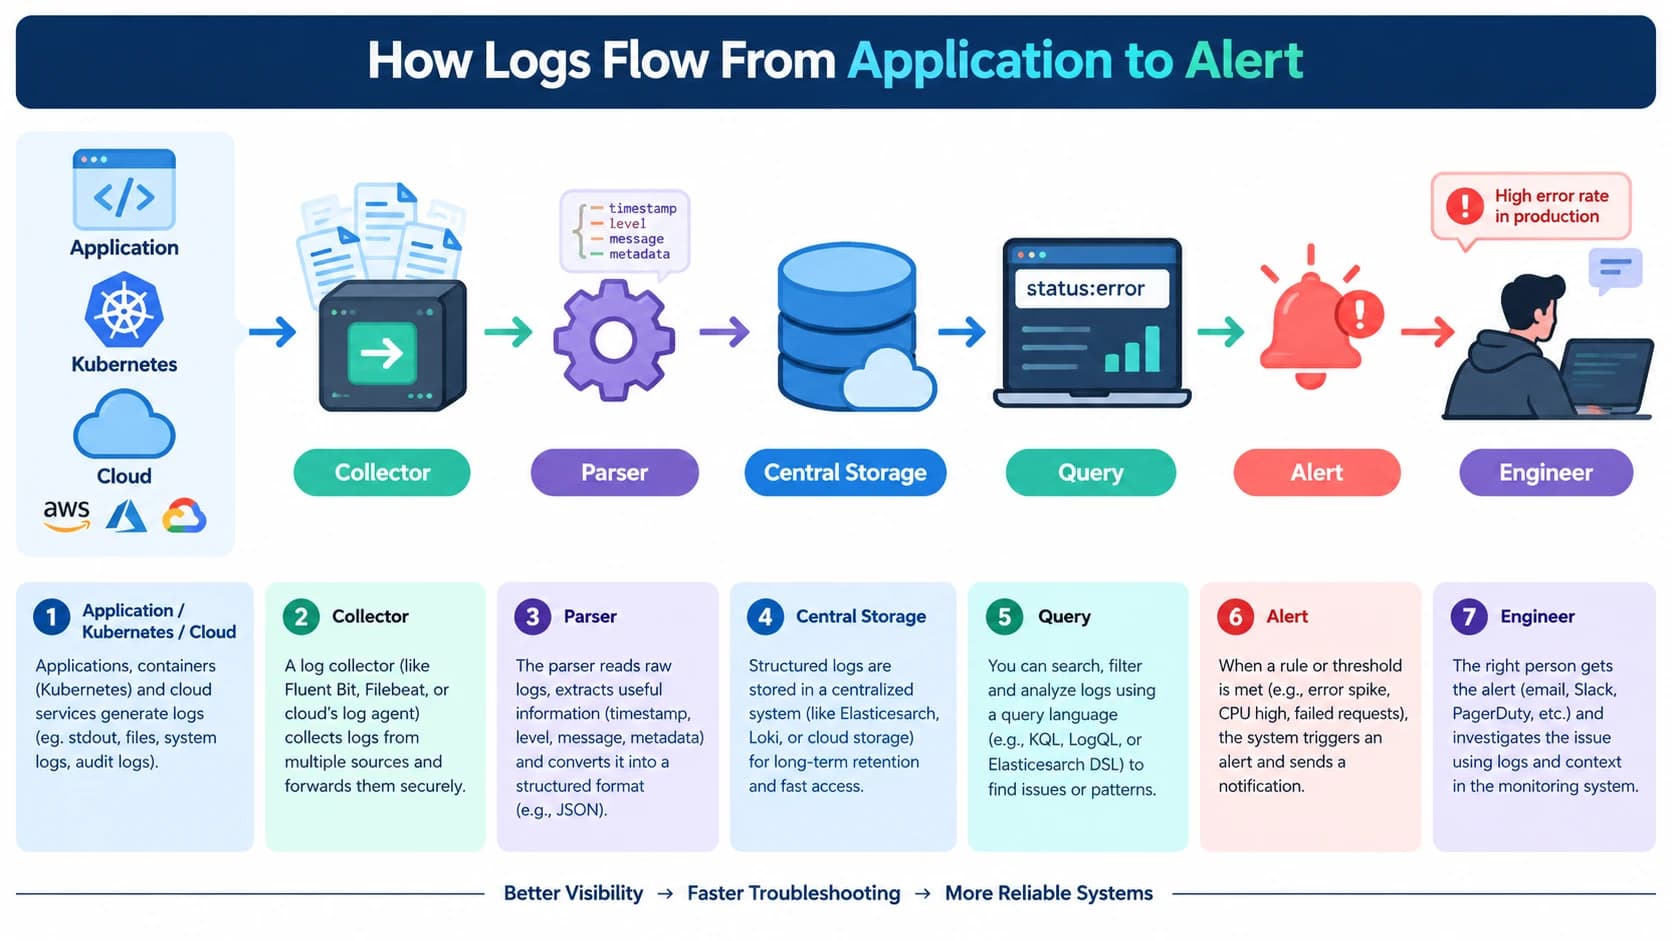
Log Generation
Applications, operating systems and infrastructure write events. In modern environments this happens across hundreds of short-lived containers and services at once.
Log Collection
Agents running beside your workloads read those events and forward them. On Kubernetes this is typically a DaemonSet on every node, so nothing is lost when a pod dies.
Log Parsing and Enrichment
Raw lines are turned into structured fields, timestamps are normalised to UTC, and metadata such as environment and service name is attached. Structured formats like JSON make this step cheaper and more reliable.
Log Aggregation and Storage
Processed logs land in a central, searchable store. Indexing choices made here directly affect query speed and cost.
Log Search and Analysis
Engineers query the data to investigate issues, for example all ERROR-level logs from one service in the last half hour, or all requests slower than two seconds from a given region.
Alerting and Incident Response
Rules watch for thresholds, patterns and anomalies. When one fires, the alert goes to the right on-call person with enough context to start fixing the problem immediately.
Log Monitoring Architecture
A production-grade architecture moves logs through six layers: sources, collection, processing, storage, visualization, and alerting and response. Centralising everything is the goal. Once your infrastructure spans more than a handful of hosts, logging in to individual servers to read files stops being workable.
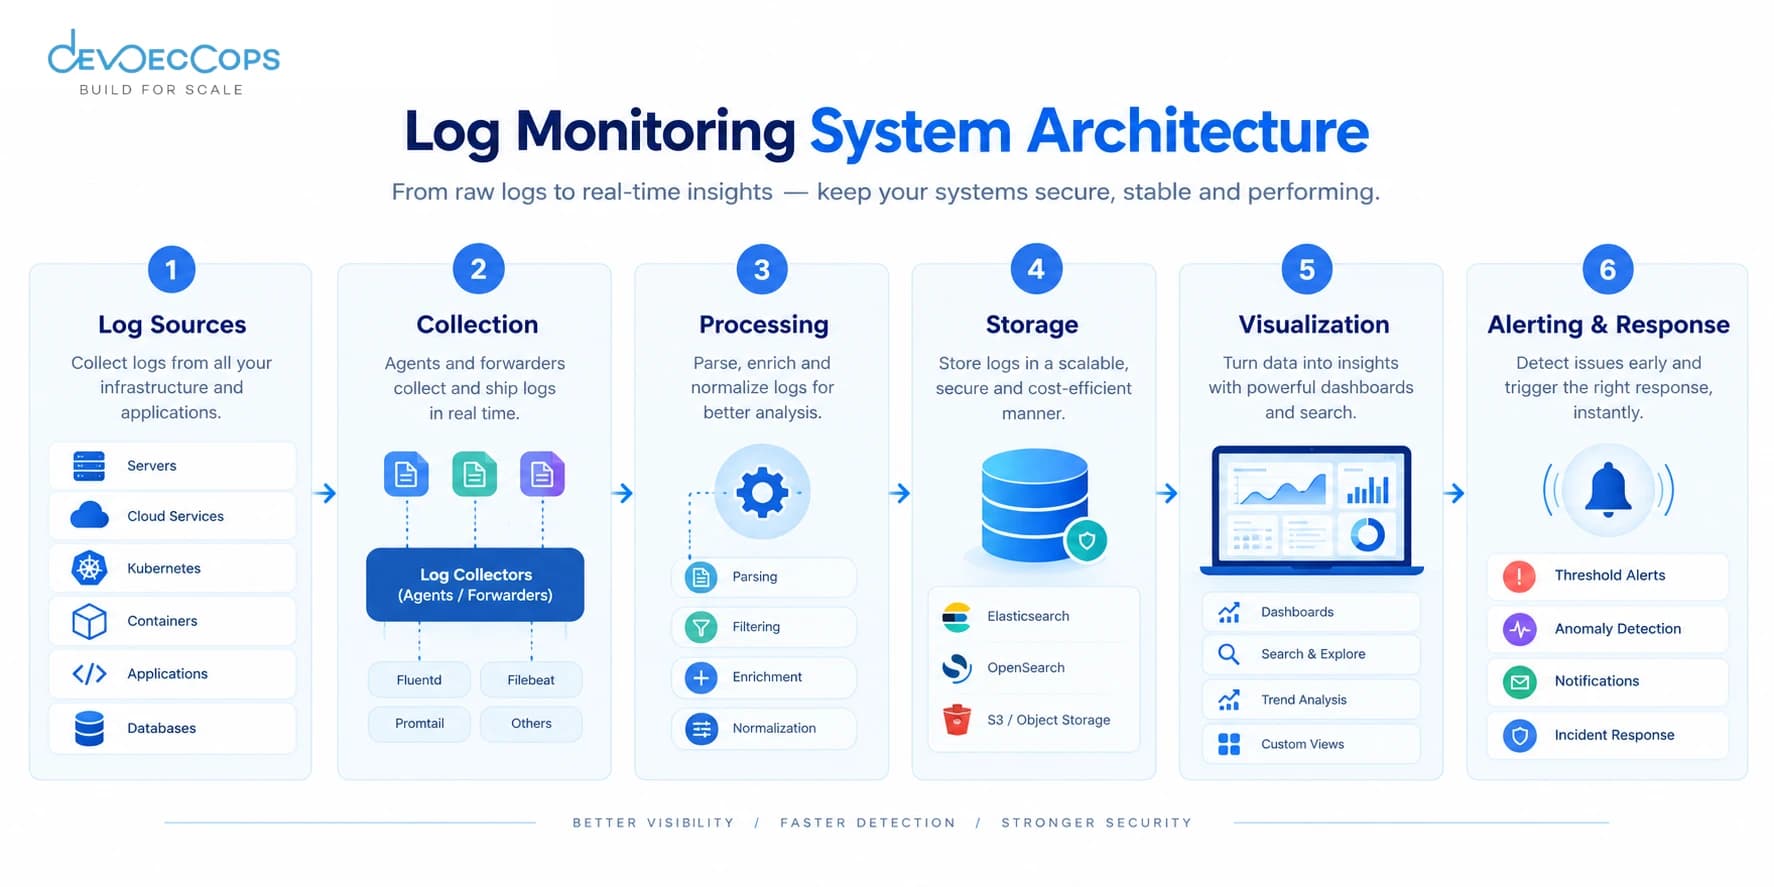
Log Sources
Applications, containers, operating systems, databases, load balancers, firewalls, cloud services and CI/CD tools. Decide up front which sources are in scope, since every unmonitored source is a blind spot.
Collection Layer
Lightweight agents or collectors on each host or node, plus cloud-native integrations. Their job is to read, tag and forward reliably, with local buffering so short outages do not lose data.
Processing Layer
Parsing, filtering, redaction of sensitive fields, enrichment and routing. Many teams place a message queue such as Kafka between collection and storage, so traffic spikes do not overwhelm the backend.
Storage Layer
A searchable store for recent logs and low-cost object storage for long-term retention. Lifecycle rules move data between tiers automatically.
Visualization Layer
Dashboards and a query interface for engineers, with role-based access so each team sees only what it should.
Alerting and Response Layer
Alert rules, routing to Slack, email or on-call tools, and runbooks that tell responders what to check first. This layer is where monitoring becomes action.
Steps to Build a Log Monitoring System
Here's a step-by-step guide to creating a log monitoring system that aligns with modern DevOps service company practices and leverages DevOps technologies.
Step 1: Define Requirements
Before selecting log monitoring tools, identify your system's needs.
- What types of logs do you need to monitor (e.g., application logs, basic error logs, security logs)?
- Do you require cloud log management for distributed environments?
- What are your compliance requirements for security log management?
- How real-time does the monitoring need to be?
For example, a DevOps service company running a CI/CD pipeline with ArgoCD may prioritize monitoring deployment logs to ensure smooth rollouts.
Step 2: Choose the Right Tools
Selecting the right tools logging solutions depends on your infrastructure and budget. Here are some popular log monitoring tools.
- ELK Stack: Ideal for application log analysis and central log management. It combines Elasticsearch for storage, Logstash for processing, and Kibana for visualization.
- Grafana Loki: A lightweight, cost-effective solution for cloud log management, especially for Kubernetes-based environments.
- Splunk: A powerful event logging software for enterprise-grade logging monitoring and security log management.
- AWS CloudWatch: Best for cloud log management in AWS environments, offering seamless integration with other AWS services.
- Prometheus and Grafana: Suitable for monitoring metrics alongside logs, especially in CI/CD pipeline with ArgoCD.
When evaluating tools, consider scalability, ease of integration, and support for your specific cloud and frontend requirements.
Step 3: Set Up Log Collection
Deploy log collectors like Fluentd or Filebeat on your servers or containers. Configure them to collect logs from relevant sources, such as:
- Server log monitoring software for system-level logs (e.g., /var/log/syslog).
- Application logs from frameworks like Node.js, Spring Boot, or Django.
- Cloud logs from platforms like AWS, Azure, or GCP.
Ensure logs are tagged with metadata (e.g., source, timestamp, environment) for easier application log analysis.
Step 4: Centralize Log Storage
Set up a centralized storage solution like Elasticsearch or Loki. For cloud log management, ensure the storage solution supports high availability and scalability. Configure retention policies to manage storage costs, keeping only the necessary logs for compliance and analysis.
Step 5: Implement Log Analysis and Visualization
Use logging monitor tools to create dashboards that display key metrics, such as error rates, API response times, or security events. For example:
- Create a Kibana dashboard to visualize basic error logs by application module.
- Set up alerts for critical events, such as a surge in security log management alerts indicating a potential breach.
DevOps AI tools can enhance analysis by automatically identifying patterns or anomalies, reducing manual effort.
Step 6: Integrate with CI/CD Pipelines
For organizations using CI/CD pipeline with ArgoCD, integrate log monitoring into the deployment process. For example:
- Monitor deployment logs to detect failed rollouts or configuration errors.
- Use event logging software to track pipeline events, such as build failures or rollbacks.
- Leverage DevOps technologies like Kubernetes to collect container logs and integrate them with your log monitoring system.
Step 7: Ensure Security and Compliance
Implement security logging and monitoring by configuring your log monitoring system to detect and flag suspicious activities. For example:
- Monitor for repeated failed login attempts or unauthorized API access.
- Use server log monitoring software to track changes to critical system files.
- Ensure logs are encrypted during transmission and storage to meet compliance requirements.
Step 8: Test and Optimize
Regularly test your log monitoring system to ensure it captures all relevant logs and triggers alerts as expected. Optimize log parsing rules to reduce noise and focus on actionable insights. Use application log analysis to identify recurring issues and improve system performance.
Step 9: Configure Retention and Cost Controls
Keep recent logs, often 7 to 30 days, in fast storage and archive the rest cheaply for compliance. Filter or sample low-value logs at the collection layer and set budget alerts on ingestion volume.
Step 10: Continuously Improve Monitoring
Review alerts monthly, retire the ones nobody acts on, and add coverage after every incident. Track metrics such as mean time to detect and mean time to resolve to prove the system is improving.
Not sure where your logging setup actually stands? Get a scoped log monitoring assessment.
Get a Log Monitoring AssessmentWhich of the Following is the Popular Monitoring Logging Tool?
Among the many log monitoring tools available, the ELK Stack, Splunk, and Grafana Loki are some of the most popular. The choice depends on your use case.
- ELK Stack: Best for open-source, customizable central log management.
- Splunk: Ideal for enterprises needing advanced security log management and event logging software.
- Grafana Loki: Suitable for lightweight cloud log management in containerized environments.
If you are looking for the tool used for log monitoring inside a single cloud, the native services (AWS CloudWatch, Azure Monitor or Google Cloud Logging) are the usual choice, and collectors such as Fluent Bit or the OpenTelemetry Collector can feed any of these tools.
More Log Monitoring Tools and How to Choose One
The tools above cover the most common choices. These additional options are worth evaluating, especially for cloud-native, multicloud and vendor-neutral setups. Logging and monitoring tools fall into three groups: collectors that gather and route logs, backends that store and search them, and cloud-native services that bundle both inside one provider.
Azure Monitor
Azure Monitor Logs, backed by Log Analytics workspaces, stores and queries logs from Azure resources using the Kusto Query Language (KQL). It is the natural option for Microsoft-centric estates.
Google Cloud Logging
Collects platform, service and audit logs from Google Cloud with built-in routing, retention controls and the Logs Explorer for search. Best for teams that run mainly on GCP.
Fluent Bit and Fluentd
Lightweight, widely used collectors that read, parse, enrich and forward logs to nearly any backend. Fluent Bit is the smaller, faster option and a common Kubernetes DaemonSet; Fluentd offers a larger plugin ecosystem.
OpenTelemetry Collector
A vendor-neutral pipeline for logs, metrics and traces. Standardising on it lets you change backends later without re-instrumenting every service. Confirm log support for your language and SDK versions before committing.
How to Choose a Log Monitoring Tool
Start with five questions: How much log data do you produce per day? Which clouds and platforms must you cover? Who will run the system? What retention and compliance rules apply? What can you spend on ingestion and storage? Then use this table as a starting point.
| Your situation | Sensible starting point |
|---|---|
| Single cloud, small team | The provider's native logging service |
| Kubernetes-heavy and cost-sensitive | Fluent Bit + Loki + Grafana |
| Need powerful search and want to own the stack | ELK or OpenSearch |
| Enterprise security and compliance focus | Splunk or a SIEM-integrated platform |
| Multicloud and wary of lock-in | OpenTelemetry Collector + one central backend |
Whatever you pick, test it with realistic log volume before committing, and check how pricing behaves as ingestion grows.
Log Monitoring Use Cases
Understanding the definition matters less than knowing what log monitoring lets you do. These are the situations where teams rely on it most.
Application Debugging
Application log monitoring is the most common use case. When users report intermittent errors on one feature, you filter by route and status code, compare behaviour before and after the latest release, and find the failing code path in minutes instead of reproducing the issue by hand.
Cloud Infrastructure Monitoring
Load balancer logs showing repeated unhealthy-target errors, database slow-query logs and storage throttling events explain why a healthy-looking application suddenly misbehaves. Reading infrastructure logs next to application logs gives the full picture.
Kubernetes Troubleshooting
When a pod is stuck in CrashLoopBackOff or cannot pull its image, the application may have produced no useful output at all. Kubernetes events and kubelet logs usually name the cause, such as a missing secret or a bad image tag, if you captured them before they expired.
Security Monitoring
Bursts of failed logins across many accounts, access from unusual locations and unexpected privilege changes all leave log traces. For teams without a dedicated SIEM, alerting on these patterns is often the first line of intrusion detection.
Performance Monitoring
Slow degradation rarely trips a fixed threshold. Trend views of request duration, retry counts and queue wait times from logs expose gradual drift in a dependency long before users complain.
CI/CD and Deployment Monitoring
Pipeline and GitOps logs show which commit broke a build or why a sync failed. With ArgoCD, correlating sync events with application logs links a bad release to its symptoms immediately, which speeds up rollback decisions.
Compliance and Audit Trails
When an auditor asks who accessed sensitive records or changed a critical setting, centralised, searchable and properly retained logs turn a multi-week scramble into a query. Many teams find their log monitoring setup doubles as their compliance evidence store.
Reliability Insights and SLO Tracking
Logs can feed reliability metrics directly: error rates per service, retry storms, timeouts and saturation signals. Turning them into log reliability insights lets teams track service level objectives and spot fragile components before they cause incidents.
Common Log Monitoring Challenges
Every log monitoring rollout runs into some version of these problems.
High Log Volume and Noise
Busy platforms generate enormous volumes, and most of it is routine. Fix it at the source with sensible log levels, structured fields and filtering at the collection layer rather than after you have paid to ingest it.
Alert Fatigue
Alerts that fire constantly teach people to ignore them. Alert on user-impacting conditions, tune thresholds against real baselines, and retire any alert nobody has acted on for months.
Log Storage Costs
Storing everything in fast, indexed storage gets expensive quickly. Tier your data, keep recent logs hot, move older logs to cheap object storage, and drop or sample logs that carry no operational value.
Distributed System Complexity
One user action may touch a dozen services. Without a trace or request ID passed through every hop, correlating those entries is guesswork. This needs discipline in application code, not just in the monitoring layer.
Inconsistent Log Formats
Different teams and frameworks log in different shapes, which makes cross-service queries painful. Agree a shared schema, enforce it in code review or linting, and normalise stragglers in the processing layer.
Sensitive Data in Logs
Passwords, tokens, card numbers and personal data have a habit of leaking into logs. Mask or drop them at the collector, restrict access by role, and audit your logs periodically for leaks.
Log Monitoring Best Practices
To maximize the effectiveness of your log monitoring system, follow these best practices.
- Standardize Log Formats: Use structured logging (e.g., JSON) for easier parsing and analysis.
- Automate Alerts: Configure alerts for critical events to ensure timely responses.
- Scale for Growth: Design your system to handle increasing log volumes as your infrastructure grows.
- Leverage AI: Use DevOps AI tools to automate anomaly detection and predict potential issues.
- Regular Audits: Periodically review logs for compliance and optimize retention policies.
More Best Practices to Follow
- Use Appropriate Log Levels: Reserve DEBUG for development or on-demand troubleshooting, default production to INFO, and use WARN and ERROR for conditions that deserve attention.
- Include Context and Metadata: Every line should answer what happened, where, and in what context: service, environment, version and relevant identifiers.
- Use Request and Trace IDs: Pass an ID through every downstream log line so root-cause analysis works in distributed systems.
- Create Actionable Alerts: Alert on business-impacting conditions, attach a runbook to each alert, and retire alerts nobody acts on.
- Define Log Retention Policies: Set retention by purpose (debugging, incident response, compliance) and automate the lifecycle.
- Protect Sensitive Data: Redact secrets and personal data before storage, and restrict access by role.
- Optimize Log Costs: Use tiered storage, filtering and per-team ingestion budgets as volume grows.
Logging Techniques and Log Optimization
These techniques reduce cost and noise without losing the signal.
- Structured logging: machine-readable fields instead of free text.
- Sampling: keep a representative fraction of high-volume, low-value events.
- Deduplication and rate limiting: collapse repeated identical errors into one counted entry.
- Dynamic log levels: raise verbosity temporarily during an incident, then lower it again.
- Filtering at the source: drop health-check chatter before it leaves the host.
- Tiered storage: hot for days, cold for months.
Want this checklist as a reference your team can work through together? Our free Log Monitoring Checklist covers 15 checks across 5 areas in about 5 minutes.
Log Monitoring vs Log Management
The terms overlap, but their scope differs. Log management covers the full lifecycle of log data. Log monitoring is the real-time watching and alerting layer on top.
| Log monitoring | Log management |
|---|---|
| Real-time analysis | Collection and storage |
| Detection of problems | Retention and archiving |
| Alerting and response | Lifecycle and policy management |
| Operational visibility | Governance and compliance |
A team can manage logs without monitoring them, for example archiving to object storage purely for compliance. But useful monitoring depends on solid log management underneath it.
The Log Management Process
A healthy log management process follows six stages: collect, centralise, parse and normalise, store and index, retain and archive, and dispose securely. Monitoring sits on the third and fourth stages, reading fresh data as it arrives and alerting before it ages into the archive.
Log Monitoring vs Observability
Observability asks whether you can understand a system's internal state from the signals it emits. Logs are one of three core signals, alongside metrics and traces. Log monitoring is therefore a part of observability, not a replacement for it.
Logs
Detailed, event-level evidence: exact errors, inputs, identifiers and context. They are the richest signal and the most expensive to keep.
Metrics
Compact numeric measurements over time, such as request rate, error percentage and CPU use. They are cheap to store and ideal for alerting on symptoms.
Traces
The path of a single request across services, with timing for each hop. They show where in a distributed system time and failures accumulate.
Why Correlation Matters
Each signal is limited alone. A metric alert tells you something is wrong, a trace narrows down where, and the matching logs explain the cause. The practical way to link them is to share IDs and labels across all three, which OpenTelemetry standardises. Teams that can jump from alert to trace to log in a few clicks resolve incidents far faster.
Log Monitoring in Kubernetes and Cloud-Native Environments
Kubernetes Logging Challenges
Pods are ephemeral, so local logs vanish when they are rescheduled. Services are numerous and noisy, and the interesting signal is often split between application output, node components and the control plane.
Container Log Collection
Have applications write to standard output and error, and run a collector such as Fluent Bit or the OpenTelemetry Collector as a DaemonSet that reads container logs from each node, adds pod, namespace and label metadata, and forwards them to your central backend.
Kubernetes Events
Events record scheduling decisions, failed probes, image pull errors and evictions, but the cluster keeps them only briefly by default. Export them to your log system so they remain searchable after an incident.
Multi-Cluster Logging
With several clusters, add cluster, region and environment labels at collection time and send everything to one aggregation point, so engineers search one system instead of one per cluster.
Cloud-Native Log Aggregation
Combine container logs, control-plane logs, cloud load balancer logs and audit logs in the same backend. Consistent labels let you follow a request from the edge down to the pod.
Cloud Log Monitoring and Multicloud Logging
Most organisations now run across several providers, and log monitoring from the cloud has to cope with that reality.
Native Cloud Logging Services Compared
Here is how the three major providers' operational logs, audit logs and query tooling line up.
| Provider | Operational logs | Audit logs | Query tooling |
|---|---|---|---|
| AWS | CloudWatch Logs | CloudTrail | CloudWatch Logs Insights |
| Azure | Azure Monitor Logs (Log Analytics) | Activity Log and Microsoft Entra logs | Kusto Query Language (KQL) |
| Google Cloud | Cloud Logging | Cloud Audit Logs | Logs Explorer and Log Analytics |
Which Cloud Computing Services Provide the Most Comprehensive Logging and Auditing?
No single provider wins outright, because comprehensiveness depends on which services and identity systems you use. AWS CloudTrail has very broad service coverage for API activity. Azure pairs its Activity Log with deep identity logging through Microsoft Entra, which suits Microsoft-centric organisations. Google Cloud records administrative activity in audit logs that are always on. Defaults and retention differ for each, so check current documentation and make sure the audit logs you need are enabled, exported and retained long enough for your compliance needs.
Multicloud Logging and Multicloud Log Management
A workable multicloud approach usually includes:
- One central backend for search and alerting, instead of one tool per cloud.
- A shared schema and labels (cloud, account or project, region, service, environment) so queries work everywhere.
- A vendor-neutral collection layer such as the OpenTelemetry Collector to avoid lock-in.
- Synchronised clocks across environments so timelines line up.
- Cost and data-residency awareness, since moving logs between clouds incurs transfer charges and may cross legal boundaries.
- Centralised access control so permissions are consistent across all log sources.
Cloud-Based Log Management: Build or Buy?
Self-hosting gives control and can be cheaper at very large scale, but it means running, scaling and securing the system yourself. Managed cloud-based log management reduces operational burden and speeds up setup, at the cost of recurring fees and less control. Many teams start managed and revisit the decision when volume or compliance needs change.
AI-Powered Log Monitoring
AI does not replace good logging, but it helps people cope with volume. Treat its output as a prioritised lead, not a verdict, and keep sensitive data out of any external model.
Automated Anomaly Detection
Models learn normal behaviour per service and flag deviations, such as a sudden rise in a rare error, without you hand-tuning thresholds for every metric.
Log Pattern Recognition
Clustering groups millions of similar lines into a handful of patterns, so you review distinct problems instead of repeated noise.
Alert Prioritization
Correlating related alerts and ranking them by likely impact reduces pager noise and surfaces the incident that matters first.
Log Summarization
Language models can summarise a burst of related logs into a plain-language description of what changed, which speeds up hand-offs and post-incident write-ups.
Root Cause Analysis
AI can suggest likely causes by linking an anomaly to a recent deployment, config change or upstream failure. Engineers should always verify those suggestions against the underlying logs.
Log Monitoring Checklist
Use this list to check your own setup. Aim to tick every item.
- Logs from every source are collected centrally
- Structured logging with a shared schema
- Metadata on every log (service, environment, version)
- Request or trace IDs in every log line
- Retention and archive policies defined and automated
- Dashboards for the signals you act on
- Actionable alerts with owners and runbooks
- Security monitoring for logins, access and changes
- Kubernetes logs and events captured
- CI/CD and deployment logs integrated
- Cloud audit logs enabled, exported and retained
- Sensitive data masked before storage
- Cost controls and ingestion budgets in place
- Alerts and parsing rules reviewed monthly
- Compliance requirements mapped to log retention
Frequently Asked Questions
Q01What is log monitoring?
Log monitoring is the continuous, real-time collection, analysis and alerting on log data from applications, servers and infrastructure, so teams can spot problems, investigate incidents and maintain visibility.
Q02Why is log monitoring important?
It shortens the time to detect and resolve incidents, improves security visibility, supports performance tuning and provides the audit trail needed for compliance.
Q03How does log monitoring work?
Logs are generated, collected by agents, parsed and enriched, stored centrally, searched and analysed, and evaluated by alert rules that notify the right people.
Q04What is the tool used for log monitoring?
Common choices include the ELK Stack, Grafana Loki, Splunk, and cloud-native services such as AWS CloudWatch, Azure Monitor and Google Cloud Logging, usually with a collector like Fluent Bit or the OpenTelemetry Collector.
Q05What is the difference between logging and monitoring?
Logging records events as they happen. Monitoring continuously watches data and alerts when something looks wrong. Logging provides the data; monitoring turns it into action.
Q06What is the difference between log monitoring and log management?
Log management covers collection, storage, retention and disposal of logs. Log monitoring is the real-time analysis and alerting built on top of it.
Q07How does log monitoring work in Kubernetes?
A collector runs on each node, reads container output, adds pod and namespace metadata and ships logs to a central backend. Kubernetes events and control-plane logs are collected alongside them.
Q08How does log monitoring support security?
It detects repeated failed logins, unauthorised access and suspicious configuration changes as they happen, and keeps an audit trail for investigations and compliance.
Q09What is the difference between logs, metrics and traces?
Logs are detailed event records, metrics are numeric measurements over time, and traces follow a single request across services. Together they make up observability.
Q10Can AI be used for log monitoring?
Yes. AI helps with anomaly detection, pattern grouping, alert prioritisation and summarisation. Its findings should be verified by engineers, and sensitive data should be protected.
Q11Which cloud services provide the most comprehensive logging and auditing?
AWS, Azure and Google Cloud all offer mature logging and audit services, such as CloudTrail, the Azure Activity Log and Google Cloud Audit Logs. The most comprehensive option depends on the services you use, so verify what is enabled and retained.
Q12How do you manage logs across multiple clouds?
Send logs from every cloud to one central backend, use a vendor-neutral collector, standardise labels and schemas, synchronise clocks, and manage access and costs centrally.
A log monitoring system is only as good as the decisions behind it: what to collect, where to store it, and who gets paged when it matters.
Want a second pair of eyes on your logging setup before you build it the hard way?
Talk to a DevOps ExpertConclusion
A well-designed log monitoring system is essential for maintaining visibility into your applications and infrastructure. By leveraging DevOps technologies and log monitoring tools, organizations can achieve real-time insights, improve troubleshooting, and enhance security log management. Integrating log monitoring with CI/CD with ArgoCD ensures seamless deployments and operational efficiency. Moreover, embracing DevSecCops.ai empowers teams to embed security and intelligent analytics into every stage of the development lifecycle, proactively identifying risks and optimizing performance. Whether you're a DevOps service company or managing a cloud-native application, a log monitoring system powered by DevSecCops.ai is a critical investment for long-term success in today's dynamic digital environment.
Need help building this? Talk to our SRE team.