
How to Create a Log Monitoring System for Real-Time Visibility
In today’s fast-paced digital landscape, ensuring the health and security of applications and infrastructure is critical for businesses. A log monitoring system provides real-time visibility into system performance, security events, and operational issues, enabling teams to proactively address problems. By leveraging DevOps AI tools and modern DevOps technologies, organizations can build robust log monitoring solutions that integrate seamlessly and enhance operational efficiency. This blog will guide you through creating a log monitoring system, exploring its components, tools, and best practices, while incorporating central log management and security logging and monitoring for a comprehensive solution.

What is Log Monitoring?
Log monitoring refers to the process of collecting, analyzing, and visualizing log data generated by applications, servers, and infrastructure components. Logs are records of events, errors, or activities within a system, often stored in log files. What is system logging? It’s the mechanism by which systems generate these records, which can include basic error logs, transaction details, or security log management data. A log monitoring system ensures that these logs are continuously tracked, providing insights into system health, performance bottlenecks, and potential security threats.
Why Are Logs Important?
Logs are the backbone of observability in IT systems. They serve multiple purposes:
- Troubleshooting: Basic error logs help identify the root cause of application failures or performance issues.
- Security: Security logging and monitoring track suspicious activities, such as unauthorized access attempts or anomalies, ensuring security log management.
- Performance Optimization: Application log analysis reveals bottlenecks, slow queries, or resource-intensive processes.
- Compliance: Logs provide an audit trail for regulatory requirements, especially in industries like finance and healthcare.
- Operational Insights: Event logging software helps teams understand system behavior and user interactions.
Without a robust log monitoring system, organizations risk delayed issue detection, prolonged downtimes, and security vulnerabilities.
Key Components of a Log Monitoring System
Building a log monitoring system requires integrating several components to ensure scalability, reliability, and real-time visibility. Here’s a breakdown of the essential elements:
1. Log Collection
Log collection involves gathering log files from various sources, such as servers, applications, databases, and cloud services. Tools like Fluentd, Logstash, or Filebeat can aggregate logs from distributed systems, ensuring central log management. For cloud-based environments, cloud log management solutions like AWS CloudWatch or Google Cloud Logging are popular choices.
2. Log Storage
Once collected, logs need to be stored efficiently for analysis. Central log management systems like Elasticsearch or Loki provide scalable storage solutions. These platforms allow you to index logs for quick retrieval and support application log analysis through advanced querying capabilities.
3. Log Analysis and Processing
Log file monitoring involves parsing and analyzing logs to extract meaningful insights. Tools like the ELK Stack (Elasticsearch, Logstash, Kibana) or Grafana Loki enable teams to filter, search, and visualize log data. DevOps AI tools can enhance this process by using machine learning to detect anomalies or predict issues based on historical log patterns.
4. Visualization and Alerting
Real-time visibility requires intuitive dashboards and alerting mechanisms. Logging monitoring tools like Kibana, Grafana, or Splunk provide customizable dashboards to visualize log data. Alerts can be configured to notify teams via email, Slack, or PagerDuty when specific thresholds are breached, such as a spike in basic error logs.
5. Security and Compliance
For security log management, logs must be analyzed for potential threats, such as repeated failed login attempts or unusual API calls. Server log monitoring software like Splunk or Sumo Logic can integrate with SIEM (Security Information and Event Management) systems to enhance security logging and monitoring.

Steps to Build a Log Monitoring System
Here’s a step-by-step guide to creating a log monitoring system that aligns with modern DevOps service company practices and leverages DevOps technologies:
Step 1: Define Requirements
Before selecting log monitoring tools, identify your system’s needs:
- What types of logs do you need to monitor (e.g., application logs, basic error logs, security logs)?
- Do you require cloud log management for distributed environments?
- What are your compliance requirements for security log management?
- How real-time does the monitoring need to be?
For example, a DevOps service company running a CI/CD pipeline with ArgoCD may prioritize monitoring deployment logs to ensure smooth rollouts.
Step 2: Choose the Right Tools
Selecting the right tools logging solutions depends on your infrastructure and budget. Here are some popular log monitoring tools:
- ELK Stack: Ideal for application log analysis and central log management. It combines Elasticsearch for storage, Logstash for processing, and Kibana for visualization.
- Grafana Loki: A lightweight, cost-effective solution for cloud log management, especially for Kubernetes-based environments.
- Splunk: A powerful event logging software for enterprise-grade logging monitoring and security log management.
- AWS CloudWatch: Best for cloud log management in AWS environments, offering seamless integration with other AWS services.
- Prometheus and Grafana: Suitable for monitoring metrics alongside logs, especially in CI/CD pipeline with ArgoCD.
When evaluating tools, consider scalability, ease of integration, and support for is it best logging solutions for cloud frontend requirements.
Step 3: Set Up Log Collection
Deploy log collectors like Fluentd or Filebeat on your servers or containers. Configure them to collect logs from relevant sources, such as:
- Server log monitoring software for system-level logs (e.g., /var/log/syslog).
- Application logs from frameworks like Node.js, Spring Boot, or Django.
- Cloud logs from platforms like AWS, Azure, or GCP.
Ensure logs are tagged with metadata (e.g., source, timestamp, environment) for easier application log analysis.
Step 4: Centralize Log Storage
Set up a centralized storage solution like Elasticsearch or Loki. For cloud log management, ensure the storage solution supports high availability and scalability. Configure retention policies to manage storage costs, keeping only the necessary logs for compliance and analysis.
Step 5: Implement Log Analysis and Visualization
Use logging monitor tools to create dashboards that display key metrics, such as error rates, API response times, or security events. For example:
- Create a Kibana dashboard to visualize basic error logs by application module.
- Set up alerts for critical events, such as a surge in security log management alerts indicating a potential breach.
DevOps AI tools can enhance analysis by automatically identifying patterns or anomalies, reducing manual effort.
Step 6: Integrate with CI/CD Pipelines
For organizations using CI/CD pipeline with ArgoCD, integrate log monitoring into the deployment process. For example:
- Monitor deployment logs to detect failed rollouts or configuration errors.
- Use event logging software to track pipeline events, such as build failures or rollbacks.
- Leverage DevOps technologies like Kubernetes to collect container logs and integrate them with your log monitoring system.
Step 7: Ensure Security and Compliance
Implement security logging and monitoring by configuring your log monitoring system to detect and flag suspicious activities. For example:
- Monitor for repeated failed login attempts or unauthorized API access.
- Use server log monitoring software to track changes to critical system files.
- Ensure logs are encrypted during transmission and storage to meet compliance requirements.
Step 8: Test and Optimize
Regularly test your log monitoring system to ensure it captures all relevant logs and triggers alerts as expected. Optimize log parsing rules to reduce noise and focus on actionable insights. Use application log analysis to identify recurring issues and improve system performance.
Which of the Following is the Popular Monitoring Logging Tool?
Among the many log monitoring tools available, the ELK Stack, Splunk, and Grafana Loki are some of the most popular. The choice depends on your use case:
- ELK Stack: Best for open-source, customizable central log management.
- Splunk: Ideal for enterprises needing advanced security log management and event logging software.
- Grafana Loki: Suitable for lightweight cloud log management in containerized environments.
Best Practices for Log Monitoring
To maximize the effectiveness of your log monitoring system, follow these best practices:
- Standardize Log Formats: Use structured logging (e.g., JSON) for easier parsing and analysis.
- Automate Alerts: Configure alerts for critical events to ensure timely responses.
- Scale for Growth: Design your system to handle increasing log volumes as your infrastructure grows.
- Leverage AI: Use DevOps AI tools to automate anomaly detection and predict potential issues.
- Regular Audits: Periodically review logs for compliance and optimize retention policies.
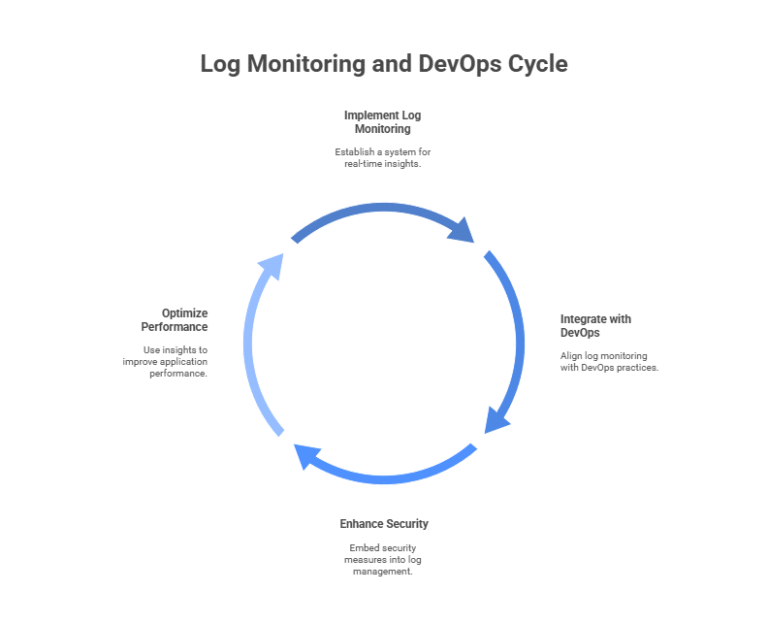
Conclusion
A well-designed log monitoring system is essential for maintaining visibility into your applications and infrastructure. By leveraging DevOps technologies and log monitoring tools, organizations can achieve real-time insights, improve troubleshooting, and enhance security log management. Integrating log monitoring with CI/CD with ArgoCD ensures seamless deployments and operational efficiency. Moreover, embracing DevSecCOps.AI empowers teams to embed security and intelligent analytics into every stage of the development lifecycle, proactively identifying risks and optimizing performance. Whether you’re a DevOps service company or managing a cloud-native application, a log monitoring system powered by DevSecCops.ai is a critical investment for long-term success in today’s dynamic digital environment.