
In the digital world today, reliability is essential, timeliness is required. A reliable log monitoring system is an important part of of reliable applications, timely discovery of your security risks and proactive performance effort.
This guide investigates the way log monitoring systems provide system reliability, connect with DevOps systems, and interact with security monitoring systems to provide end to end observability. We will noted the way they are used in pipelines in DevOps, MLOps platforms, and devops genai i, and how DevSecOps.ai can add value to your monitoring with AI.
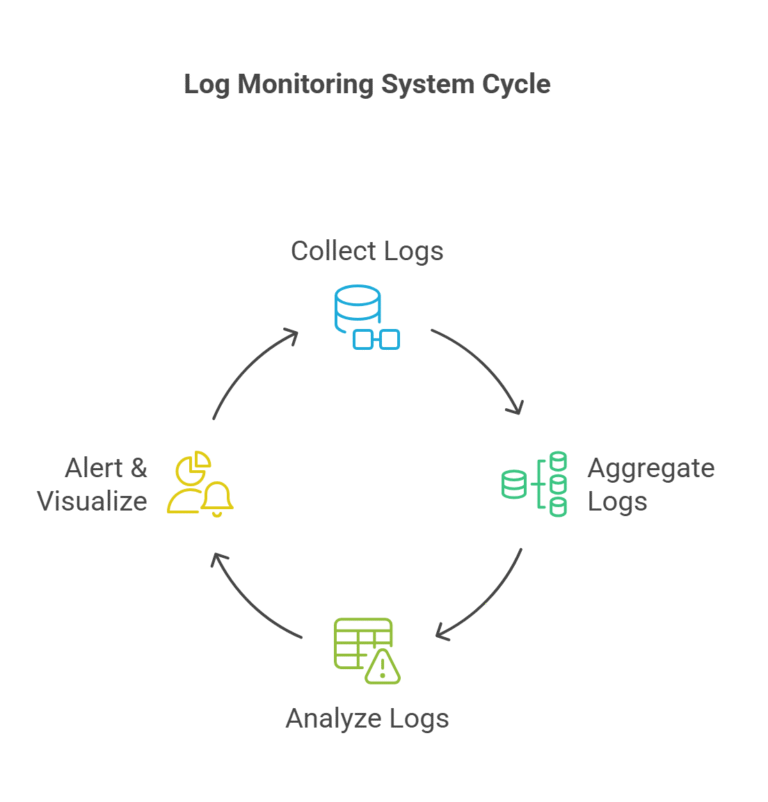
A log monitoring system collects, analyzes, and visualizes log data from applications, servers, and infrastructure. It helps teams:
✔ Detect anomalies in real-time
✔ Troubleshoot issues faster
✔ Improve security by identifying threats
✔ Optimize performance with data-driven insights
Log monitoring integrates with security monitoring systems to:
✅ Detect intrusion attempts (SIEM tools like Splunk, Wazuh)
✅ Identify unauthorized access (audit logs)
✅ Comply with regulations (GDPR, SOC 2)
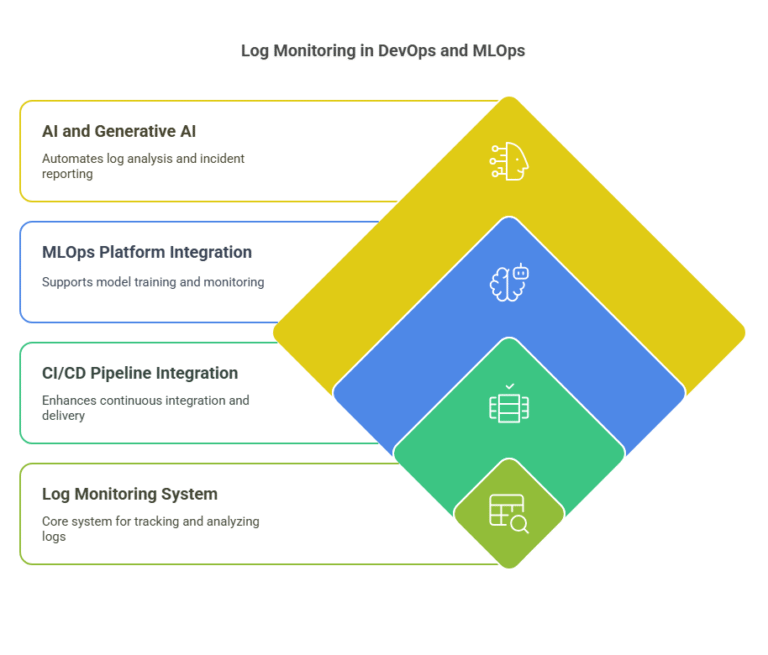
A well-integrated log monitoring system enhances CI/CD pipelines by:
🔹 Tracking build failures (Jenkins, GitHub Actions logs)
🔹 Monitoring deployment health (Kubernetes logs via ArgoCD)
🔹 Ensuring compliance ( audit logs for change tracking)
Example:
MLOps platforms rely on logs for:
✔ Model training monitoring (GPU usage, errors)
✔ Inference latency tracking (API response times)
✔ Data drift detection (Anomalies in input data)
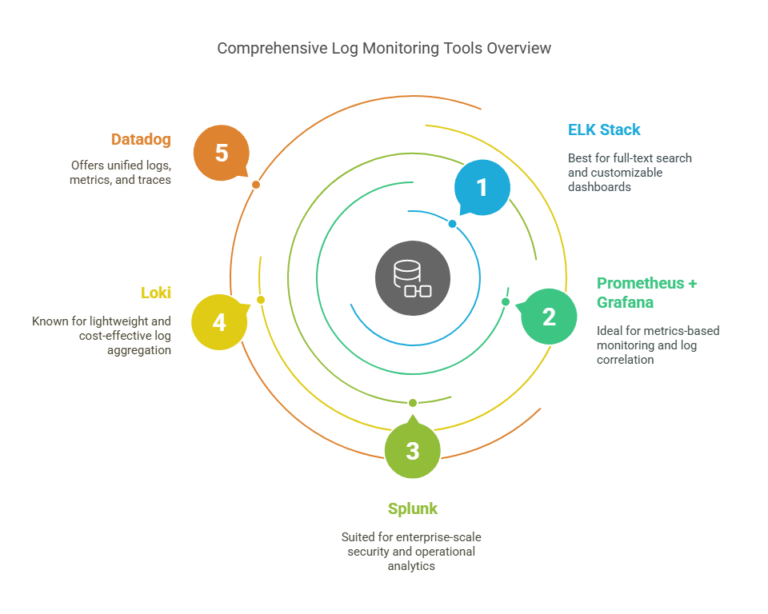
Tools:
Generative AI in DevOps transforms log monitoring by:
🔸 Automating log parsing (Natural Language Processing)
🔸 Predicting failures (Machine Learning models)
🔸 Generating incident reports (AI-powered summaries)
Example:
As systems grow more complex, traditional log monitoring alone isn’t enough. AI-powered log analysis is the future, enabling:
🔹 Anomaly detection (Unsupervised ML models)
🔹 Automated incident classification (NLP-based tagging)
🔹 Predictive maintenance (Forecasting failures)
DevSecCops.ai integrates AI-driven log monitoring with security and DevOps pipelines, providing:
✅ Automated threat detection
✅ Smart log correlation
✅ GenAI-powered troubleshooting

A log monitoring system is no longer optional—it’s a core pillar of system reliability. By integrating with DevOps technologies, security monitoring systems, and MLOps platforms, organizations gain end-to-end observability.
With advancements in generative AI in Devops, log analysis is becoming smarter, faster, and more automated. Tools like DevSecCops.ai further enhance this by combining AI-driven insights with security and compliance monitoring.
Log monitoring prevents downtime by detecting issues early
Security logs are critical for threat detection
AI & GenAI are revolutionizing log analysis
DevSecCops.ai bridges the gap between logs, security, and automation
Embrace intelligent log monitoring today to build more reliable, secure, and high-performing systems!